The setup
Say you have a bulk upload flow. A user drops a CSV file with tens or hundreds of thousands of rows, and for every row you need to answer one question: does this key already exist in our data warehouse?
The straightforward way to write this is also the way almost everyone writes it first:
for _, row := range rows {
    exists, err := store.QueryRow(ctx, "SELECT 1 FROM raw_data WHERE key = ? LIMIT 1", row.Key)
    // ...
}
It is easy to read, easy to review, and it is correct. It also works fine in a demo with 50 rows. Then someone uploads a real file with 200K+ rows and the request just… sits there, for seconds, sometimes longer.
Why it falls apart specifically on OLAP
If the backing store were a normal OLTP database (Postgres, MySQL) with a B-tree index on the key column, a loop of point lookups is not great, but it is survivable: each lookup is cheap, index seeks are what these engines are built for.
An OLAP store like ClickHouse is a different animal, and the loop punishes exactly the properties that make it fast at the things it’s actually good at:
- Every query pays fixed overhead, no matter how small. Parsing, planning, and network round-trip cost don’t scale down with the size of the question you’re asking. Ask “does this one key exist” 200,000 times and you pay that fixed cost 200,000 times.
- OLAP engines are built for scanning, not seeking. Column-oriented storage and vectorized execution win big when you ask one query to look at millions of rows at once. A
WHERE key = ?for a single value doesn’t use any of that; you’re asking a bulk-optimized engine to do retail work. - Round trips dominate once you multiply by row count. Even a query that runs in a few milliseconds server-side turns into a real problem once you serialize it a couple hundred thousand times, one after another, over the network.
The result is a check whose cost grows linearly with upload size, dominated almost entirely by per-request overhead rather than by actual work done. In one real case this pattern was clocked at up to ~2.45 seconds and roughly 1.9 million allocations for a 214K-row file. That’s not because ClickHouse is slow; it’s because the access pattern was fighting the engine.
The fix: batch-insert, then ask once
The fix isn’t a faster loop. It’s not looping at all.
Instead of asking the store “does X exist” once per row, you flip the shape of the problem:
- Batch-insert the candidate keys from the file into a small staging table (one round trip, one write).
- Run a single set-based query, a
JOINor aggregate between the staging table and the target table, that answers “which of these exist” for the entire batch in one pass. - Clean up the staging rows afterward (or let them expire).
-- one batch insert of the whole file's candidate keys
INSERT INTO staging_keys (file_id, key) VALUES (...), (...), ...;

-- one query, not N queries, answers it for the whole set
SELECT
    s.key,
    t.key IS NOT NULL AS exists_in_target
FROM staging_keys s
LEFT JOIN target_data t ON s.key = t.key
WHERE s.file_id = ?;
This is the access pattern OLAP engines are actually built for: one query, a full columnar scan, vectorized execution across the whole set. You’re no longer fighting the engine’s design. You’re using it.
The same real-world case above went from ~2.45s down to roughly ~15ms per operation after this change. That’s not a tuning win, it’s a change of algorithm: from O(N) round trips to O(1).
The general lesson
This isn’t really about ClickHouse, or CSV uploads, or SKUs. It’s a pattern that shows up any time you have:
- a bulk operation over N items, and
- a store whose engine is optimized for set-at-a-time work (columnar/OLAP, but also plenty of “big data” systems, search indices, etc.)
The instinct to reach for a loop comes from OLTP-shaped thinking, where each row is its own small transaction. It’s the wrong mental model for a store built to answer questions about millions of rows at once. If you notice a loop making a network call to a warehouse-style store, that’s usually a sign the operation wants to be rewritten as “load the batch in, then ask one question about the whole batch.”
Before / after, visually
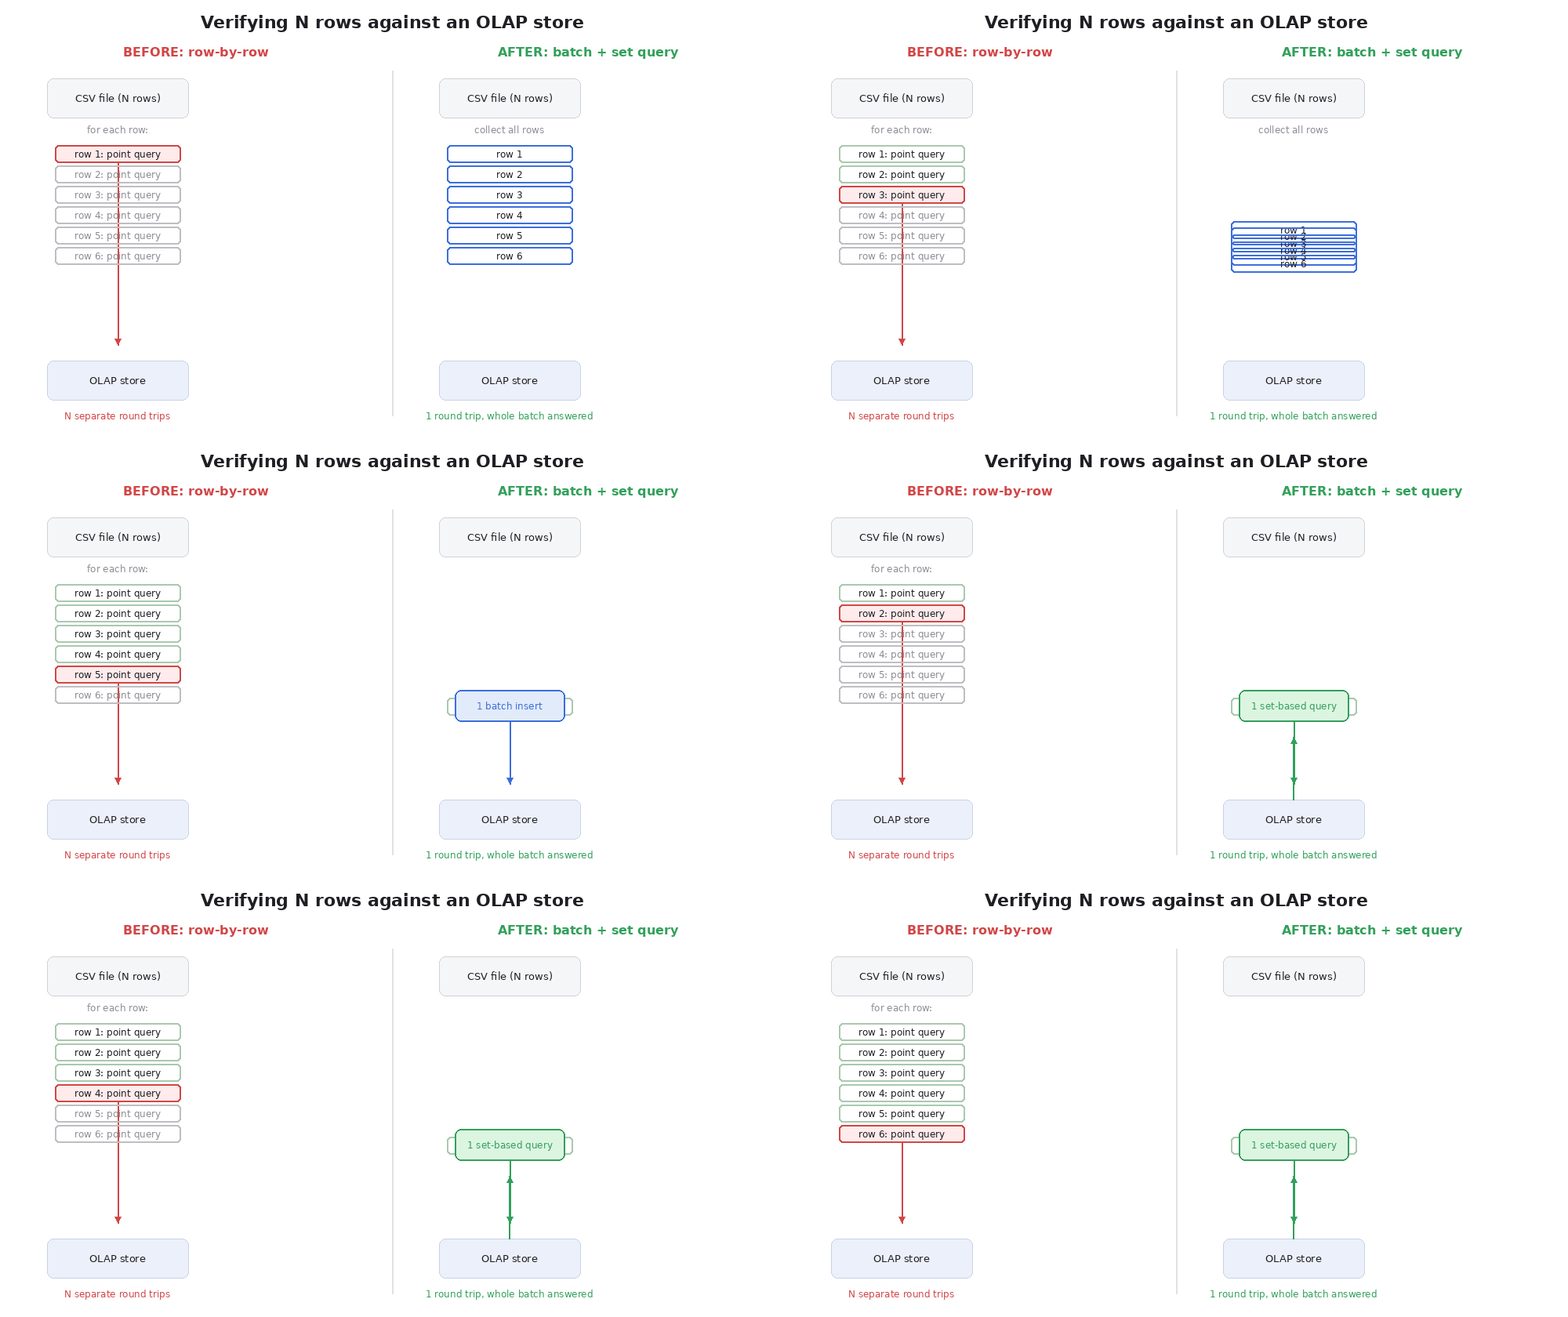
(Left: the CSV rows loop one at a time into individual point queries against the OLAP store. Right: the same rows get batch-inserted once, followed by a single set-based query that answers existence for the whole file.)
Reproducing it
The companion repo, clickhouse-batch-vs-row-bench, runs both strategies against a real ClickHouse instance (docker compose up -d, then go test -bench=. -benchmem ./bench/) using deterministic synthetic keys, no real schema involved. A local run on a laptop gave this:
| candidate keys | row-by-row | batch |
|---|---|---|
| 1,000 | 3.42s | 273ms |
| 5,000 | 19.62s | 221ms |
| 20,000 | 84.50s | 344ms |
| 100,000 | (not run, see below) | 551ms |
Row-by-row is capped at 20K keys by default in that benchmark, because it’s already past a minute there; at that rate, running it at 100K would mean waiting several more minutes to confirm a trend that’s already obvious. Allocation counts tell the same story: at 20K keys, row-by-row makes just under 3 million allocations against batch’s ~221K for the same input.
These are local-Docker numbers, not production ones, so don’t expect them to match the ~2.45s figure earlier in this post exactly. What they do confirm is the shape of the claim: row-by-row cost grows linearly and eventually badly, batch stays close to flat.
A note on the numbers earlier in this post: the ~2.45s / ~15ms figures are from a real production change, described here from memory rather than a fresh benchmark. Treat them as an anecdote. The table above is the independently reproducible version of that claim.