Most Postgres tuning posts are a list of parameters with recommended values. I wanted something I could work through on a real database instead, so this series is organized by mistake. Each section starts with what you’d notice, gives a query or command that confirms the problem, then the fix and a way to check that the fix worked. You can run the checks against your own database in order.
It’s written for backend engineers who own a Postgres database but aren’t DBAs. All the demos are Go programs using pgx, because a few of these problems only show up through the driver and never in psql.
The series has three parts:
- Memory and connections, mistakes 1 to 5 (this post)
- Query plans and maintenance, mistakes 6 to 14
- Extensions from Go: pg_stat_statements, auto_explain, pg_buffercache, pg_prewarm, pgstattuple, pg_repack, hypopg and pgvector
Every number in the series comes from a scenario in postgres-tuning that you can rerun yourself.
The setup
- PostgreSQL 18.6 in a local k3d (k3s v1.35) cluster. The pod is capped at 2 CPUs and 2 GiB of memory, with
shared_buffers = 512MB. - pgx v5.11, PgBouncer 1.26, pgvector 0.8.7, hypopg 1.4.3, pg_repack 1.5.3.
- A 4-core laptop. The load generator runs as a Kubernetes Job in the same cluster so that
kubectl port-forwarddoesn’t show up in latency numbers. - A shop-like schema: 100 cities in 10 countries, 1M customers, 10M orders (1.5 GB with indexes). Order status is skewed: 90% delivered, 0.01% refunded.
make cluster-up build deploy
make run S=seed
make run S=genericplan    # or any other scenario; output lands in results/
A laptop isn’t a production server. The absolute numbers won’t transfer, but the before/after ratios and the plan changes should. The README lists every scenario.
How I measured
A few rules made the numbers repeatable enough to trust:
- Alternate the before and after runs (A, B, A, B, …) instead of running all of A and then all of B. Otherwise one side gets a warmer cache and you end up measuring cache state.
- Throw away a warm-up run and report the median of several runs. On this machine the same query varied between 77 ms and 230 ms across consecutive runs while I was exploring, which is more than many of the effects I wanted to measure.
- Report p99 next to the mean for anything concurrent. In the connection pooling test below, the median latency barely moved while p99 got six times worse.
- Give the database pod
requests == limits(Guaranteed QoS in Kubernetes) so its CPU allowance doesn’t depend on whatever else the node is doing. - Keep the load generator next to the database. A
port-forwardtunnel adds its own latency and its own variance.
The load generator (internal/bench) is about 150 lines. It runs a function from N goroutines for a fixed time, keeps every latency sample and sorts them for percentiles.
1. Tuning before measuring
If you change settings without a baseline, you can’t tell whether a change helped, and you’ll probably tune the wrong thing. The query people complain about is rarely the one using the most database time.
Check. Is pg_stat_statements installed and collecting?
SELECT * FROM pg_extension WHERE extname = 'pg_stat_statements';
SHOW shared_preload_libraries;  -- must include pg_stat_statements
It has to be in shared_preload_libraries because it allocates shared memory at startup (docs), and then you run CREATE EXTENSION in each database you want to query it from. Managed services often preload it already, so check before you plan a restart.
Fix. Install it, let it collect for a representative period, and save a baseline before touching anything:
CREATE TABLE pgss_baseline AS
SELECT now() AS taken_at, queryid, calls, total_exec_time, mean_exec_time, rows,
       shared_blks_hit, shared_blks_read
FROM pg_stat_statements;
Then look at where the time goes:
SELECT calls,
       round(total_exec_time) AS total_ms,
       round((100 * total_exec_time / sum(total_exec_time) OVER ())::numeric, 1) AS pct,
       round(mean_exec_time::numeric, 2) AS mean_ms,
       left(query, 80)
FROM pg_stat_statements
ORDER BY total_exec_time DESC
LIMIT 10;
Verify. After each change, reset (SELECT pg_stat_statements_reset()), run the same workload, and join the new numbers to pgss_baseline on queryid.
What the demo showed (make run S=measure). Eight sessions ran a shop-like mix for a minute (70% customer lookups by id, 25% “latest orders for a customer”, 5% “latest orders by status”) while a cron-style report ran every 5 seconds:
| Query | Calls | Share of total time | Mean |
|---|---|---|---|
| latest 10 orders for a customer | 90,751 | 49.7% | 0.88 ms |
| VIP revenue report | 13 | 25.0% | 3,082 ms |
| latest 50 orders by status | 18,197 | 13.8% | 1.22 ms |
| customer by id | 254,601 | 11.5% | 0.07 ms |
The most frequent query used the least time. A report that ran 13 times took a quarter of it. The real target is the per-customer listing: half the database time, and only 52% of its blocks came from shared_buffers. Slow-request logs would have pointed at the report. This ranking is what I’d work from for the rest of the series.
2. Copying “shared_buffers = 25% of RAM” everywhere
The docs give 25% as “a reasonable starting value” for a dedicated server with 1 GB or more of RAM (docs), partly because Postgres also relies on the OS page cache. It’s a starting value, and managed services already pick something else.
Check. The buffer cache hit ratio, and what’s actually in the cache:
SELECT round(100.0 * blks_hit / nullif(blks_hit + blks_read, 0), 2) AS hit_pct
FROM pg_stat_database WHERE datname = current_database();

-- needs CREATE EXTENSION pg_buffercache
SELECT c.relname, count(*) AS buffers, pg_size_pretty(count(*) * 8192) AS cached
FROM pg_buffercache b
JOIN pg_class c ON b.relfilenode = pg_relation_filenode(c.oid)
WHERE b.reldatabase = (SELECT oid FROM pg_database WHERE datname = current_database())
GROUP BY c.relname ORDER BY buffers DESC LIMIT 10;
blks_read counts blocks Postgres had to ask the OS for. Some of those come from the OS page cache and never touch the disk, so a low hit ratio is a reason to look further, not proof of a problem.
Fix. Size it for the workload and the platform. On Amazon RDS for PostgreSQL the default parameter group sets shared_buffers to {DBInstanceClassMemory/32768} (in 8 kB pages, so 25%). Aurora PostgreSQL uses SUM(DBInstanceClassMemory/12038,-50003), which works out to roughly two thirds to three quarters of memory (Aurora parameter reference). The reason AWS gives is that Aurora storage has “no file system or secondary level of caching for tables or indexes” (AWS blog). Copy 25% onto Aurora and you shrink the only cache you have.
Verify. Hit ratio and blks_read per second before and after, under the same workload. shared_buffers needs a restart, so this is one to plan, not to try live.
I didn’t build a demo for this one. On a 2 GiB pod the interesting range is too narrow to say anything that would transfer.
3. Raising work_mem for the whole server
A report is slow, EXPLAIN shows it spilling to disk, someone sets work_mem = 256MB in the parameter group, and the report gets faster. The trouble comes later. work_mem is a limit per sort or hash operation, not per query or per connection, and hash operations may use work_mem × hash_mem_multiplier (2.0 by default since PG 15) (docs). One query can have several such nodes, and every connection can run one.
Check.
SHOW log_temp_files;   -- set to 0 to log every temp file with its size
SELECT datname, temp_files, pg_size_pretty(temp_bytes) FROM pg_stat_database;
In EXPLAIN (ANALYZE, BUFFERS) look for Sort Method: external merge Disk: ..., or a HashAggregate with Batches: above 1 and a Disk Usage: value.
Fix. Raise it only where it’s needed: per role (ALTER ROLE reporting SET work_mem = '256MB') or per transaction. In Go:
err := pgx.BeginFunc(ctx, pool, func(tx pgx.Tx) error {
	// Gone at COMMIT; other sessions on this pooled connection never see it.
	if _, err := tx.Exec(ctx, "SET LOCAL work_mem = '256MB'"); err != nil {
		return err
	}
	_, err := tx.Exec(ctx, topCustomersReport)
	return err
})
Use SET LOCAL, not SET. A plain SET sticks to the pooled connection and leaks into whichever request gets that connection next.
Verify. Temp files gone for the target query, and memory under peak concurrency still within limits.
What the demo showed (make run S=workmem). The query is “top customers of the last 30 days”: 450k orders grouped into 365k customers.
| Plan detail | p50 of 5 | Temp files, 5 runs (pg_stat_database) |
|
|---|---|---|---|
default work_mem = 4MB |
HashAggregate, 81 batches, 15 MB on disk | 681 ms | 74 MiB (15 MB per run) |
SET LOCAL work_mem = '256MB' |
HashAggregate, 1 batch, 147 MB in memory | 567 ms | 0 |
The spill cost about 20%, less than I expected. Since PG 13, hash aggregation spills to disk in batches when it runs out of work_mem (PG 13 release notes). Memory is where it goes wrong. I ran the same report from 12 sessions at once for 30 seconds:
| 12 concurrent reports | Peak backend memory (cgroup anon) |
Outcome |
|---|---|---|
default work_mem |
137 MiB | all completed, slowly (2 CPUs) |
ALTER SYSTEM SET work_mem = '256MB' |
1,419 MiB, then killed | pod OOM-killed, Postgres restarted |
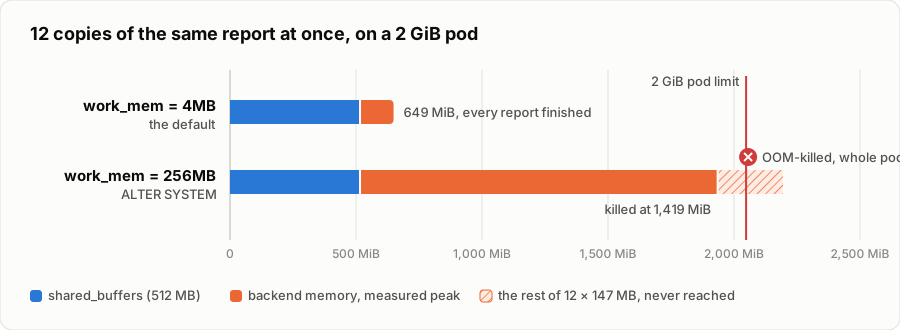
(Top: the default, 649 MiB in total. Bottom: 256MB server-wide. The pod was killed at 1,419 MiB of backend memory, before the twelve 147 MB hash tables could all fit.)
Twelve times 147 MB plus 512 MB of shared_buffers doesn’t fit in 2 GiB, and nothing in Postgres stops it from trying.
The second finding surprised me. On Kubernetes 1.28 and later with cgroup v2, the kubelet sets memory.oom.group = 1 on the container (I read it from inside the pod: 1). When the cgroup runs out of memory, the kernel kills every process in it. Postgres normally survives one backend getting OOM-killed: the postmaster resets the other backends and runs crash recovery. Here the postmaster died with them. Kubernetes reported Reason: OOMKilled and restarted the pod, and crash recovery replayed about 900 MB of WAL before the database accepted connections again. This is documented in the Kubernetes 1.28 changelog: processes in the cgroup are “treated as a unit and killed simultaneously”. Since 1.32 the kubelet setting singleProcessOOMKill: true turns this off for the whole node. For a Postgres pod, I’d rather leave enough headroom that it never comes to that.
4. Hundreds of direct connections and no pooler
Each Postgres connection is a separate OS process (docs). Ten app replicas with a pool of 50 each is 500 backends. Most of them are idle at any moment, all of them hold memory, and the ones that aren’t idle compete for CPU.
Check.
SELECT state, count(*)
FROM pg_stat_activity
WHERE backend_type = 'client backend'
GROUP BY state ORDER BY count(*) DESC;
If most rows are idle and max_connections is in the hundreds, keep reading.
Fix. Size app pools to what the database can actually run at once (in the test below, 8 connections for 2 CPUs did best), and put a pooler such as PgBouncer in front when many app instances share one database. The Postgres docs suggest the same in their section on memory overcommit: “it may be better to reduce max_connections and instead make use of external connection-pooling software” (docs).
With pgx the pool size is MaxConns:
cfg, _ := pgxpool.ParseConfig(os.Getenv("DATABASE_URL"))
cfg.MaxConns = 8
pool, err := pgxpool.NewWithConfig(ctx, cfg)
Two pgx details matter when PgBouncer is in the path:
- pgx prepares and caches every statement by default (
QueryExecModeCacheStatement). Under transaction pooling that only works if PgBouncer tracks prepared statements: supported since 1.21, on by default (max_prepared_statements = 200) since 1.24 (PgBouncer NEWS). On an older PgBouncer, switch pgx toQueryExecModeExec. The pgx docs list which modes are safe. - With libpq’s default
sslmode=prefer, pgx tries TLS first and then a plain-text fallback, stored inConfig.Fallbacks(pgconn docs). If you overrideHostandPortin code after parsing a config, the fallback keeps the old host. My PgBouncer had no TLS, so the first attempt failed and the fallback connected straight to Postgres. The benchmark ran without error and showed 301 backends where PgBouncer should have kept it to 16. Setsslmodeexplicitly in the connection string, or clearConnConfig.Fallbackswhen you change the host.
Verify. Fewer backends, the same or better throughput, lower memory, and a lower p99.
What the demo showed (make run S=pooling). 300 goroutines run the shop workload for 30 seconds against the 2-CPU database.
| Setup | Throughput | p50 | p99 | Backends | Peak backend memory |
|---|---|---|---|---|---|
pgxpool MaxConns=300, direct |
7,057 q/s | 19.5 ms | 310 ms | 301 | 510 MiB |
pgxpool MaxConns=8, direct |
12,404 q/s | 21.5 ms | 52 ms | 9 | 25 MiB |
pgxpool MaxConns=300 via PgBouncer (16 server conns) |
8,553 q/s | 31.9 ms | 68 ms | 17 | 37 MiB |
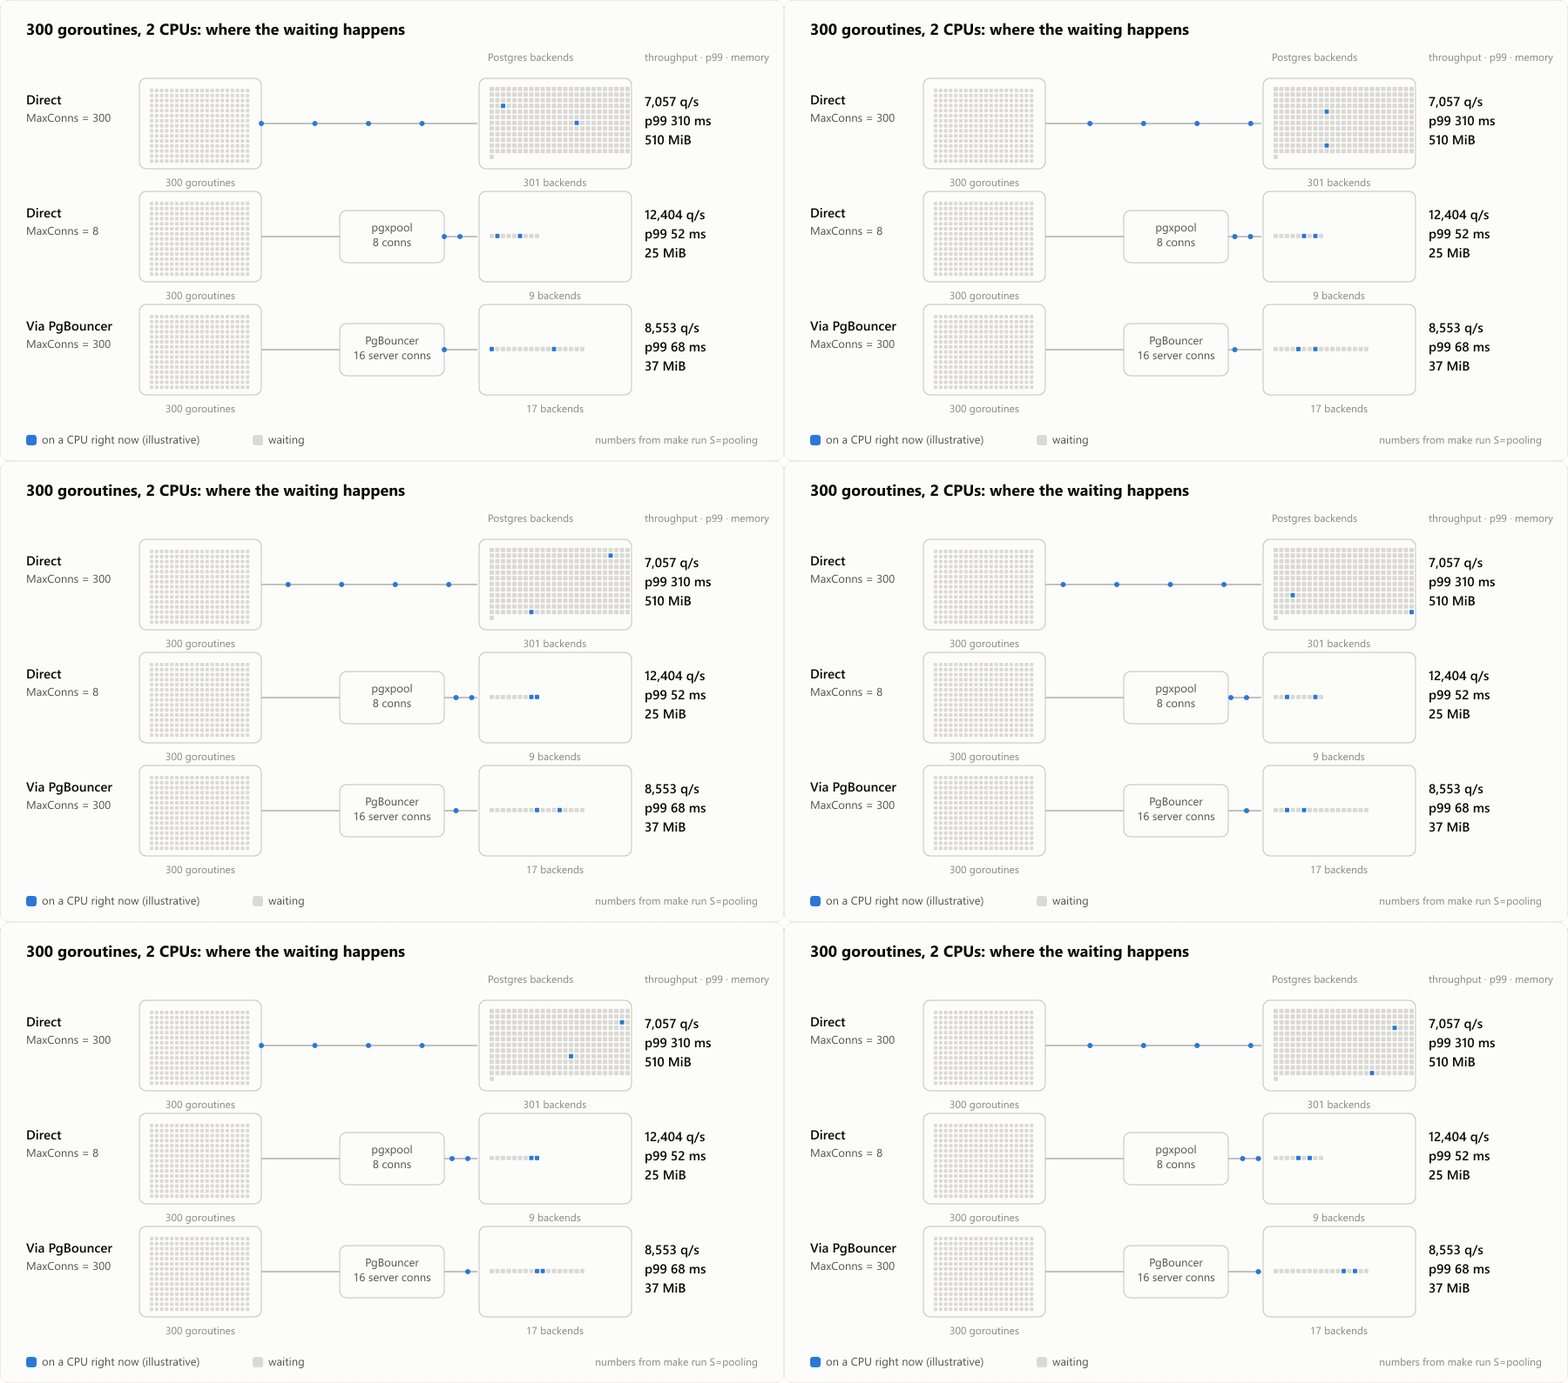
(Each square on the right is a Postgres backend. With 2 CPUs, only two run at any moment. With 301 backends the other 299 wait inside Postgres as processes that each hold memory and compete for the CPUs.)
The 8-connection pool did 76% more work with a sixth of the tail latency. The 300 goroutines still wait, but they wait in the Go pool, where waiting is cheap, instead of as 300 processes fighting over 2 CPUs. The median barely changed, which is why you need the p99 to see this.
PgBouncer fixed the tail latency and the memory without touching the app’s pool size. Throughput only rose 21%, though, because every query now crosses one more network hop and one more process. With one app instance, a right-sized pool is simpler. With many instances that each need a pool, PgBouncer is what keeps the total bounded.
5. Transactions left open (“idle in transaction”)
An open transaction stops VACUUM from removing any row version that became dead after the transaction started, in every table of the database. In Go the usual cause is an early return that skips both Commit and Rollback:
func reserveLeaky(ctx context.Context, pool *pgxpool.Pool, sku int) error {
	tx, err := pool.Begin(ctx)
	if err != nil {
		return err
	}
	var qty int
	if err := tx.QueryRow(ctx, `SELECT qty FROM it_stock WHERE sku = $1 FOR UPDATE`, sku).Scan(&qty); err != nil {
		return err // leaks too
	}
	if qty == 0 {
		return errOutOfStock // the transaction stays open, the connection never returns to the pool
	}
	// ...
	return tx.Commit(ctx)
}
The fix is one line. Rollback after a successful Commit is a no-op, so deferring it covers every return path:
	tx, err := pool.Begin(ctx)
	if err != nil {
		return err
	}
	defer tx.Rollback(ctx)
pgx.BeginFunc does the same for you.
Check.
SELECT pid, application_name, state,
       now() - xact_start AS xact_age,
       age(backend_xmin)  AS xmin_age,
       left(query, 60)    AS last_query
FROM pg_stat_activity
WHERE state LIKE 'idle in transaction%'
ORDER BY xact_start;
VACUUM (VERBOSE) on a busy table also tells you directly: look for are dead but not yet removable.
Fix. Fix the code path, and add a guard so the next bug of this kind is bounded: idle_in_transaction_session_timeout (default 0, meaning off) ends any session that sits idle inside a transaction for longer than the limit (docs). Set it per role or per application. In pgx it can go in the connection’s runtime parameters:
cfg.ConnConfig.RuntimeParams["idle_in_transaction_session_timeout"] = "5s"PG 17 also added transaction_timeout, which caps the whole transaction, idle or not.
Verify. No long-lived rows in the query above, and VACUUM reports nothing “not yet removable”.
What the demo showed (make run S=idletx). A 10,000-row stock table, with a sync job updating random rows from 4 sessions for 45 seconds per phase:
| Phase | Pool conns stuck | Dead rows VACUUM could not remove | Table size |
|---|---|---|---|
reserve() with defer tx.Rollback |
0 of 4 | 0 | 1056 kB |
reserveLeaky() hits the out-of-stock path once |
1 of 4 | 67,773 | 4296 kB |
same leak, idle_in_transaction_session_timeout = 5s |
1 of 4 (on the client side) | 0 | 1320 kB |
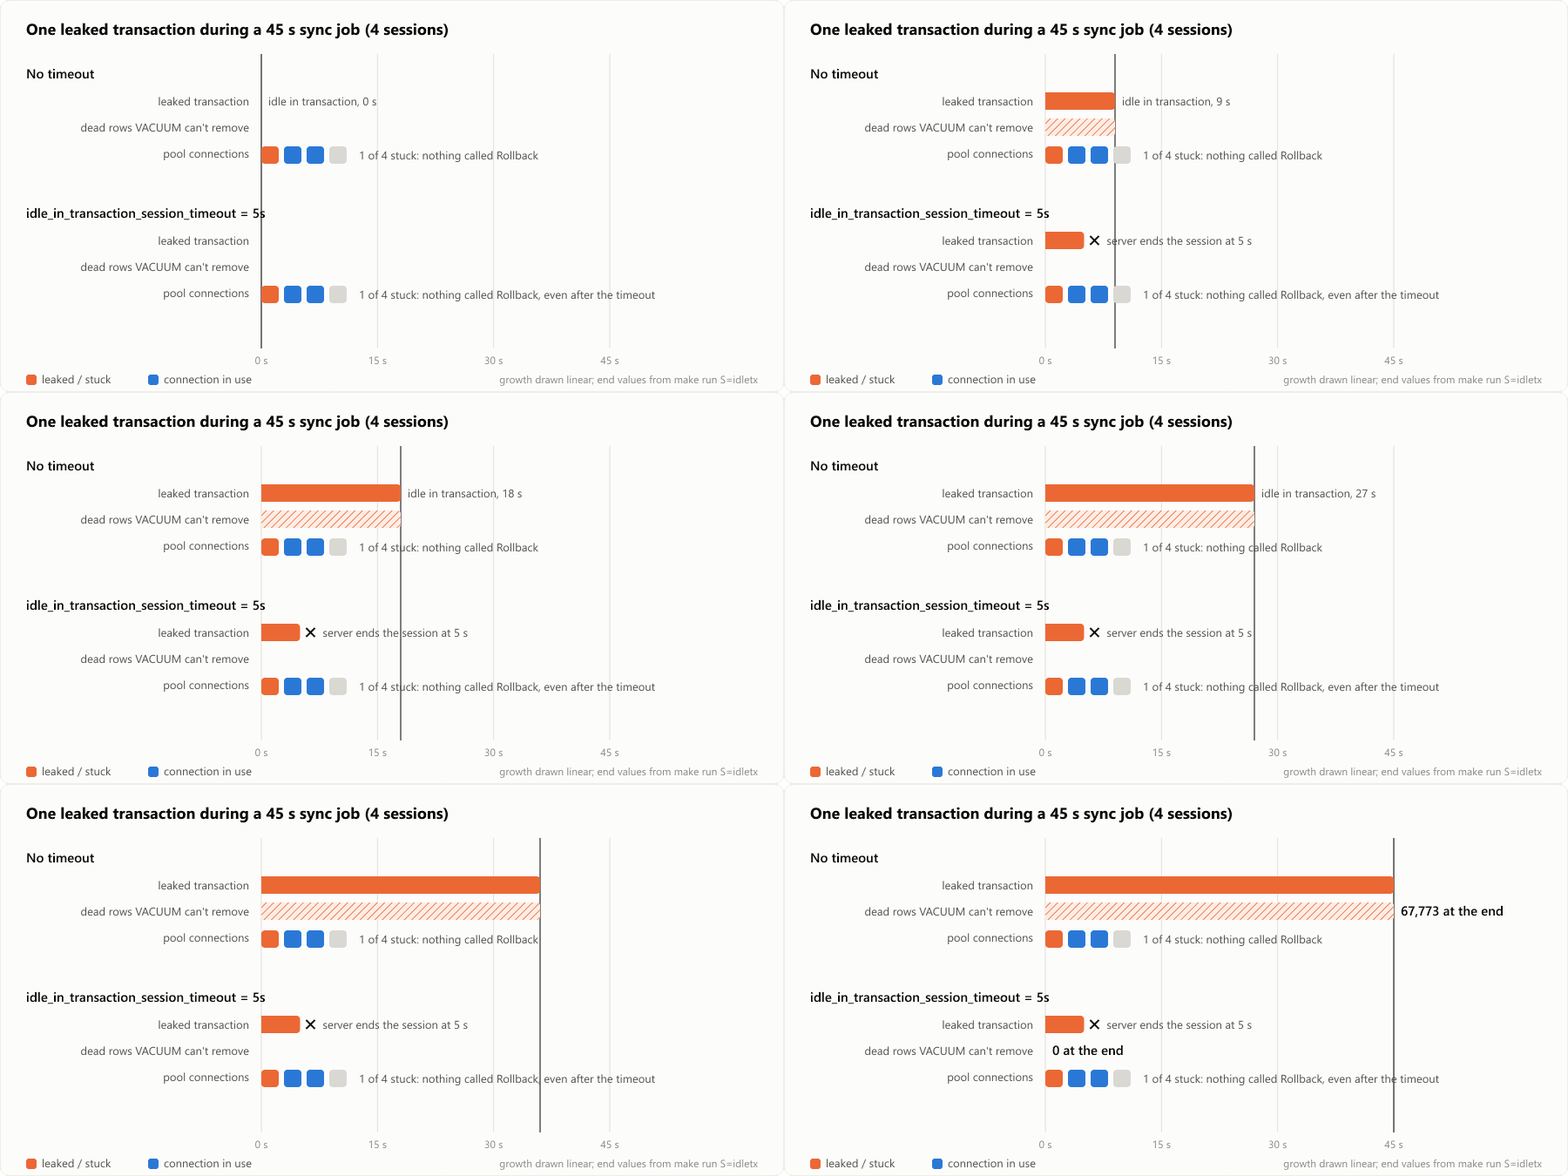
(Top: no timeout. Bottom: the 5 s timeout ends the server session, so VACUUM can clean up again, but the Go pool still holds the connection.)
One leaked transaction, 45 seconds old, kept every one of those 67,773 dead row versions: removable cutoff: 67710, which was 67775 XIDs old. On a 10k-row table the update latency didn’t change in 45 seconds: p50 stayed at 2.3 ms with and without the leak. (In the last 30 seconds of the third phase it rose to 6.7 ms. That happened after the timeout had already cleaned up, and I couldn’t tie it to anything in the test.) The damage from the leak is bloat that keeps piling up, and it applies to every table in the database, not only the one the leaked transaction touched.
Look at the second column in the last row. The timeout ends the server session, but the Go pool still counts the connection as acquired, because nothing ever called Rollback on it. The timeout limits the damage on the database side, and only the code fix gives the pool its connection back. A related trap: pool.Close() waits for every acquired connection, so a service with this bug can also hang on shutdown.
Summary of part 1
All measured on the same 2-CPU, 2 GiB Postgres 18 pod. “Before” is the mistake, “after” is the fix from that section.
| Section | What was measured | Before | After |
|---|---|---|---|
| 3. work_mem | 12 concurrent reports, peak backend memory | 1,419 MiB, pod OOM-killed (256MB server-wide) | 137 MiB (default, raise it per transaction instead) |
| 4. Pooling | 300 clients: throughput / p99 | 7,057 q/s / 310 ms | 12,404 q/s / 52 ms |
| 5. Idle in transaction | dead rows VACUUM couldn’t remove | 67,773 | 0 |
Mistake 1 has no before/after because it’s the measuring itself, and mistake 2 had no demo. Part 2 moves on to query plans and the maintenance work that keeps them good.
Sources
PostgreSQL documentation: shared_buffers and work_mem, idle_in_transaction_session_timeout, connections, memory overcommit, pg_stat_statements, PG 13 release notes.
Drivers, poolers and platforms: pgx and pgconn, PgBouncer NEWS, Kubernetes 1.28 changelog, Aurora PostgreSQL parameters, AWS blog on Aurora PostgreSQL memory parameters.
Further reading, not cited above: pganalyze on idle transactions.