This is part 2 of a series on Postgres tuning mistakes. Part 1 covers the setup, how I measured, and mistakes 1 to 5 (memory and connections). This part is about how the planner picks a plan, and the maintenance that keeps it picking good ones. Part 3 covers extensions.
Same setup as before: Postgres 18.6 in a 2-CPU, 2 GiB pod on a laptop k3d cluster, shared_buffers = 512MB, a 10M-row orders table, and a Go load generator running in the same cluster. Each section names the scenario that produced its numbers (make run S=stats and so on), and all of them are in postgres-tuning.
6. Autovacuum defaults on a large table
Autovacuum vacuums a table when its dead rows exceed autovacuum_vacuum_threshold + autovacuum_vacuum_scale_factor × reltuples, which is 50 + 0.2 × rows by default (docs). For a 100M-row table that’s 20M dead rows before anything happens. PG 18 adds autovacuum_vacuum_max_threshold, which caps the result at 100,000,000 by default. With the default scale factor that cap only kicks in above 500M rows, so it changes nothing for a 10M-row table.
Check.
SELECT s.relname, s.n_live_tup, s.n_dead_tup, s.last_autovacuum,
       least(current_setting('autovacuum_vacuum_threshold')::float8
             + current_setting('autovacuum_vacuum_scale_factor')::float8 * c.reltuples,
             current_setting('autovacuum_vacuum_max_threshold')::float8) AS triggers_at
FROM pg_stat_user_tables s JOIN pg_class c ON c.oid = s.relid
ORDER BY s.n_dead_tup DESC LIMIT 10;
(This ignores per-table overrides in pg_class.reloptions; the scenario code handles those.) For actual bloat, pgstattuple gives exact numbers; there’s more on it in part 3.
Fix. Lower the scale factor on the big, busy tables only:
ALTER TABLE events SET (autovacuum_vacuum_scale_factor = 0.01);Verify. n_dead_tup stays bounded and last_autovacuum moves.
What the demo showed (make run S=autovacuum). A 5M-row table, then 10% of its rows updated. With the defaults, autovacuum waits for 1,000,048 dead rows, so 500,000 isn’t enough:
| State | n_dead_tup | last_autovacuum | Heap fetches in the index-only scan | Mean of 5 |
|---|---|---|---|---|
| freshly vacuumed | 0 | never | 0 | 92 ms |
| 500k rows updated, 90 s later | 500,000 | never | 550,010 | 328 ms |
autovacuum_vacuum_scale_factor = 0.01 |
0 | ran within 2 minutes | 0 | 91 ms |
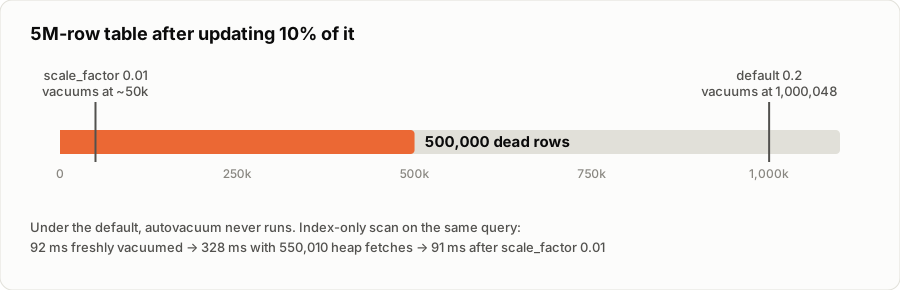
(With the default scale factor, 500,000 dead rows is only halfway to the trigger.)
The query counts rows for a range of accounts with an index-only scan. Index-only scans skip the table only for pages the visibility map marks all-visible, and only VACUUM sets those bits. After the update every touched page needed a heap visit again, and the same query got 3.5 times slower. Nothing broke, and no error showed up anywhere. The query just stayed slow, waiting for enough dead rows to pile up.
7. random_page_cost = 4 when the data is cached
random_page_cost (default 4.0) tells the planner that a random page read costs four times a sequential one. The PG 11 docs suggested that SSDs “might also be better modeled with a lower value for random_page_cost, e.g., 1.1” (PG 11 docs). Current docs dropped the SSD sentence and say instead: “if your data is likely to be completely in cache, such as when the database is smaller than the total server memory, … decreasing random_page_cost might be appropriate” (docs). Either way, at 4.0 the planner overprices index access and picks sequential scans and hash joins where an index would be faster.
Check. Find queries that sequential-scan a big table to read a small part of it, then compare plans in your session:
SHOW random_page_cost;
SET random_page_cost = 1.1;
EXPLAIN (ANALYZE, BUFFERS) <the query>;
RESET random_page_cost;
Fix. Set it for the database (ALTER DATABASE app SET random_page_cost = 1.1) or server-wide once you’ve checked the important queries.
Verify. EXPLAIN ANALYZE of the affected queries before and after, plus the pg_stat_statements totals so you notice anything that got worse.
What the demo showed (make run S=randompagecost). A revenue-by-tier report for three cities (30k customers, 300k of the 10M orders):
| random_page_cost | Plan | Median of 5 warm runs |
|---|---|---|
| 4 | Parallel Hash Join, sequential scan of all 10M orders | 2.23 s |
| 1.1 | Nested Loop, index scan on orders(customer_id) |
1.25 s |
My first attempt at this demo failed, and the failure was useful. A VIP-customer report (1% of customers) flipped plans nicely with max_parallel_workers_per_gather = 0, but didn’t flip at all with parallel query on, because the parallel nested loop was already cheaper at 4.0. Test with the settings production actually uses.
8. Stale or too-coarse statistics
The planner estimates each WHERE condition separately and multiplies the selectivities, which assumes the columns are independent. City and warehouse aren’t: every city here is served by exactly one warehouse.
Check. Estimated versus actual rows in EXPLAIN ANALYZE. A factor of 10 or more on a node that feeds a join, sort or limit is worth fixing.
Fix. ANALYZE after bulk loads (the docs recommend it). Raise the per-column statistics target for skewed columns. For correlated columns, create extended statistics (docs):
CREATE STATISTICS st_orders_city_warehouse (mcv) ON city, warehouse FROM st_orders;
ANALYZE st_orders;
Verify. Estimates close to actuals, and a different plan where it matters.
What the demo showed (make run S=stats). The query is “newest 20 orders for this city and this warehouse” on a 3M-row table, the kind of thing a support tool runs from two dropdowns. Most pairs match nothing, because the warehouse doesn’t serve that city.
| Pair | Statistics | Estimated rows | Actual rows | Plan | p50 of 10 |
|---|---|---|---|---|---|
| Jakarta / SG-WH1 | per column | 310 | 0 | walk created_at index backwards, filter |
583 ms |
| Jakarta / SG-WH1 | + CREATE STATISTICS (mcv) |
1 | 0 | bitmap scan on city, sort |
32 ms |
| Jakarta / ID-WH1 | per column | 310 | 29,936 | parallel index walk | 8.1 ms |
| Jakarta / ID-WH1 | + CREATE STATISTICS (mcv) |
33,002 | 29,936 | index walk, no parallel workers | 0.9 ms |
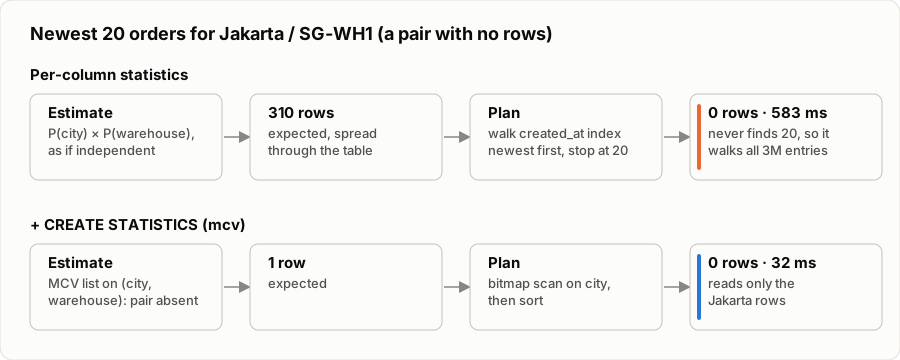
(Same query, same zero rows. The estimate decides which plan the planner picks.)
The empty case is the dangerous one. The planner expected 310 matches spread through the table, so it planned to walk the created_at index from the newest end and stop after 20. With zero matches it walked all 3M index entries. The MCV list on (city, warehouse) knows the pair doesn’t occur.
While exploring in psql I tried the two textbook examples first, and neither showed a difference on this data. A join where the corrected estimate switched a nested loop to a hash join came out slower with the hash join (256 ms vs 158 ms warm). A GROUP BY country, city, warehouse where the ndistinct estimate fell from 100,000 to 100 kept the same HashAggregate plan. Better estimates don’t always mean a faster query, so check the actual runtime and not only the estimate.
9. pgx prepared statements switch to a generic plan on skewed data
This one is specific to drivers that prepare statements, and pgx does by default. Postgres plans the first five executions of a prepared statement with the actual parameter values. After that it builds a generic plan and keeps using it if its estimated cost “is not so much higher than the average custom-plan cost” (PREPARE docs). With skewed data, the generic plan is built for an average value and is wrong for the rare one.
Symptom. A query is fast when you paste it into psql with a literal and slow when the application runs it.
Check. On the application’s own connection (the counters are per session):
SELECT name, generic_plans, custom_plans FROM pg_prepared_statements;PG 16+ can show the generic plan directly: EXPLAIN (GENERIC_PLAN) SELECT ... WHERE status = $1. And auto_explain logs the plan the slow execution actually used.
Fix. Any of these:
// Keep prepared statements, always plan with the real values.
cfg.ConnConfig.RuntimeParams["plan_cache_mode"] = "force_custom_plan"

// Or use unnamed statements, which Postgres always plans with the values.
cfg.ConnConfig.DefaultQueryExecMode = pgx.QueryExecModeExec
plan_cache_mode can also be set per role with ALTER ROLE. The cost is planning on every call, which for this query was a fraction of a millisecond.
Verify. Driver latency for the rare value matches the psql latency.
What the demo showed (make run S=genericplan). The admin page “latest 50 orders with status X”, called eight times for busy statuses, then 20 times each for delivered and refunded on one connection:
| pgx setup | generic / custom plans | delivered p50 |
refunded p50 |
|---|---|---|---|
default (QueryExecModeCacheStatement) |
3 / 5 | 0.20 ms | 135 ms |
+ plan_cache_mode = force_custom_plan |
0 / 8 | 0.29 ms | 2.2 ms |
QueryExecModeExec |
(no named statement) | 0.49 ms | 1.9 ms |
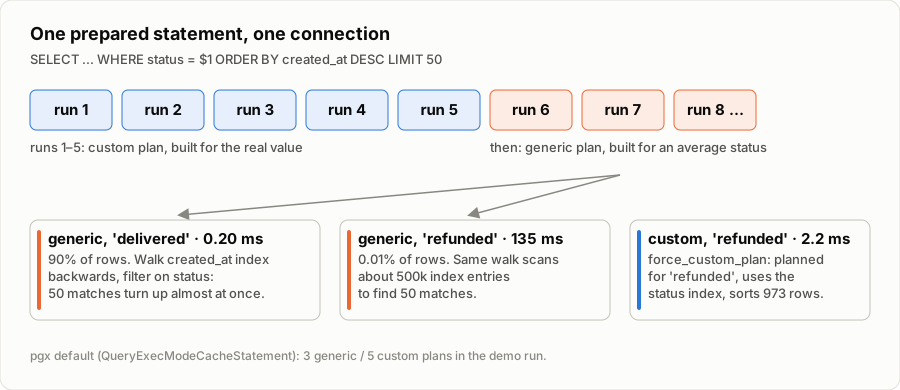
(The generic plan is fine for the common value and slow for the rare one. Orange is the generic plan, blue the custom plan.)
The generic plan walks the created_at index backwards and filters on status = $1. That’s right for delivered and terrible for refunded, which needs to scan about 500k index entries to find 50 matches. The custom plan for refunded uses the status index and sorts 973 rows.
10. Foreign key columns without an index
Postgres requires an index on the referenced side of a foreign key (the primary key) but not on the referencing column. The docs explain why it’s often worth adding anyway: a DELETE on the parent “will require a scan of the referencing table for rows matching the old value” (docs).
Check. Foreign keys whose columns aren’t the leading columns of any index:
SELECT c.conrelid::regclass AS table_name,
       string_agg(a.attname, ', ' ORDER BY x.n) AS columns,
       c.confrelid::regclass AS referenced_table,
       pg_size_pretty(pg_relation_size(c.conrelid)) AS table_size
FROM pg_constraint c
CROSS JOIN LATERAL unnest(c.conkey) WITH ORDINALITY AS x(attnum, n)
JOIN pg_attribute a ON a.attrelid = c.conrelid AND a.attnum = x.attnum
WHERE c.contype = 'f'
  AND NOT EXISTS (
    SELECT 1 FROM pg_index i
    WHERE i.indrelid = c.conrelid
      AND (i.indkey::int2[])[0:cardinality(c.conkey) - 1] @> c.conkey
  )
GROUP BY c.oid, c.conrelid, c.confrelid
ORDER BY pg_relation_size(c.conrelid) DESC;
On the demo database this found the table I built without the index, plus customers(city_id) -> cities. The second one is fine, since nobody deletes cities. Not every hit needs an index. The ones that matter are on large child tables whose parent rows get deleted or have their keys updated.
Fix. CREATE INDEX CONCURRENTLY ON child (parent_id);
Verify. EXPLAIN ANALYZE of a parent delete shows the time spent in the foreign key trigger.
What the demo showed (make run S=fkindex). Deleting 100 inactive customers (who have no orders) from a 100k-row parent with a 2M-row child table:
Time in Trigger for constraint fk_orders_customer_id_fkey |
Total | |
|---|---|---|
no index on fk_orders.customer_id |
17,852 ms (100 calls) | 17.9 s |
| with the index (built in 1.2 s) | 12 ms | 13 ms |
Every deleted parent row scanned the 2M-row child table once to prove there were no references. During those 18 seconds the delete also held row locks on the parents, so anything inserting orders for those customers would have queued behind it.
11. Unused and duplicate indexes
Every index is updated on every insert, and on every update that isn’t HOT. Each one adds WAL, which also has to be shipped to replicas and backups.
Check. Indexes never scanned since the last stats reset, skipping unique ones because those enforce constraints:
SELECT s.relname, s.indexrelname, s.idx_scan, pg_size_pretty(pg_relation_size(s.indexrelid))
FROM pg_stat_user_indexes s JOIN pg_index i ON i.indexrelid = s.indexrelid
WHERE s.idx_scan = 0 AND NOT i.indisunique
ORDER BY pg_relation_size(s.indexrelid) DESC;
And indexes whose columns are the same as, or a leading prefix of, another index on the same table:
SELECT a.indexrelid::regclass AS redundant, b.indexrelid::regclass AS covered_by
FROM pg_index a JOIN pg_index b
  ON a.indrelid = b.indrelid AND a.indexrelid <> b.indexrelid
WHERE a.indexprs IS NULL AND b.indexprs IS NULL
  AND a.indpred IS NULL AND b.indpred IS NULL
  AND NOT a.indisunique
  AND (b.indkey::text LIKE a.indkey::text || ' %'
OR (b.indkey::text = a.indkey::text AND a.indexrelid > b.indexrelid));(indkey is an int2vector. Its text form is the column numbers separated by spaces, which turns the prefix test into a LIKE. My first version compared arrays and found nothing, because array equality also compares lower bounds and int2vector starts at 0.)
Fix. Drop them with DROP INDEX CONCURRENTLY. Before you do, check that the stats window covers monthly jobs, and check replicas too: idx_scan is per server, so an index used only by reports on a read replica shows 0 on the primary.
Verify. Insert/update latency and WAL volume (pg_current_wal_lsn() deltas, or wal_bytes in pg_stat_statements).
What the demo showed (make run S=unusedindex). Four sessions inserting 100-row batches for 30 seconds:
| Indexes on the table | WAL per row | Rows inserted per second |
|---|---|---|
| primary key + 1 used index | 280 bytes | 29,407 |
| primary key + 8 (the used one, plus 7 unused, duplicate or redundant) | 870 bytes | 19,023 |
WAL per row tripled, and it was steady across three runs (279–280 bytes vs 859–997). Throughput wasn’t steady at all. The baseline came in at 69k, 42k and 29k rows/s on three runs, while the 8-index version stayed between 19k and 22k. The direction never changed, but if you only measure throughput on a shared machine, one run can tell you almost anything. WAL volume is the better number to compare.
Both detection queries worked, with one catch. The app’s query used ui_events_account_created_idx2, an exact copy of ui_events_account_created_idx, so the original showed idx_scan = 0. With an exact duplicate, which copy gets the scans is arbitrary. Run the duplicate check before the unused check, and drop duplicates first.
12. Checkpoints too frequent
If WAL fills max_wal_size before checkpoint_timeout passes, Postgres starts a checkpoint early. Frequent checkpoints mean more full-page images in WAL right after each one, and more write I/O.
Check. The log says checkpoints are occurring too frequently (with log_checkpoints, which is on in this PG 18 setup). And the counters, which moved to their own view in PG 17:
-- PG 17+
SELECT num_timed, num_requested, num_done, write_time, sync_time, buffers_written
FROM pg_stat_checkpointer;
-- PG 16 and older: checkpoints_timed, checkpoints_req in pg_stat_bgwriter
Mostly num_requested and few num_timed means WAL volume, not the timer, is driving checkpoints.
Fix. Raise max_wal_size so checkpoints are mostly timed. Keep checkpoint_completion_target at its default of 0.9 so writes are spread out.
Verify. The ratio of requested to timed checkpoints over a busy day.
No demo here. Checkpoint behavior depends on write volume and storage, and a laptop run would mostly show the laptop’s SSD.
13. JIT on queries that don’t need it
JIT compiles expressions to machine code for queries whose estimated cost is above jit_above_cost (100,000), with more expensive optimization above 500,000. It’s been on by default since PG 12. The docs are direct about the trade-off: “For short queries the added overhead of performing JIT compilation will often be higher than the time it can save” (docs). A query whose estimated cost is inflated can pay compile time it never gets back.
Check. The JIT block in EXPLAIN ANALYZE, and across the workload with pg_stat_statements (the jit_* columns arrived in PG 15):
SELECT left(query, 60), calls,
       round(mean_exec_time::numeric, 1) AS mean_ms,
       round(((jit_generation_time + jit_inlining_time + jit_optimization_time + jit_emission_time) / calls)::numeric, 1) AS jit_ms_per_call
FROM pg_stat_statements
WHERE jit_functions > 0
ORDER BY jit_ms_per_call DESC LIMIT 10;
Fix. If JIT is a large share of runtime for OLTP queries, turn it off for the application’s role (ALTER ROLE app SET jit = off) or raise jit_above_cost.
What the demo showed (make run S=jit). I couldn’t make JIT hurt on this data, and I’d rather report that than build a contrived case. Every query that crossed jit_above_cost ran for at least half a second. JIT then cost 20 to 110 ms of CPU, split across the leader and each parallel worker (each one compiles its own copy):
| VIP report (cost 154,996) | Median of 7 |
|---|---|
jit = on |
584 ms |
jit = off |
555 ms |
That 5% is within the run-to-run noise I saw on this machine. The check above is cheap, so run it before deciding either way.
14. Ignoring asynchronous I/O in PG 18
PG 18 can issue reads asynchronously, which the release notes say “can improve performance of sequential scans, bitmap heap scans, vacuums, and other operations” (PG 18 release notes). io_method picks the mechanism: worker (the default, using io_workers background processes, default 3), io_uring on Linux builds that support it, or sync for the old behavior. Changing it needs a restart (docs).
Check.
SHOW io_method;
SHOW io_workers;
SELECT * FROM pg_aios;  -- I/Os in flight right now
Fix. Start with the default. Try io_uring on Linux, and more io_workers on storage with high latency.
Verify. Sequential scan and vacuum throughput on data that isn’t cached, before and after.
What the demo showed (make aio). A single backend (no parallel workers) running count(*) on a 2.9 GB table, larger than the pod’s 2 GiB memory limit, with the OS page cache dropped before each restart:
| io_method | Scan 1 (cold) | Scans 2 and 3 | Time waiting on reads (scan 3) | Peak I/Os in flight |
|---|---|---|---|---|
sync |
7.7 s, 398 MB/s | 568, 564 MB/s | 4.6 s | 1 |
worker (default) |
7.5 s, 411 MB/s | 493, 493 MB/s | 3.8 s | 7 |
io_uring |
7.5 s, 408 MB/s | 543, 555 MB/s | 3.5 s | 7 |
No meaningful difference on this machine. All three cold scans took 7.5 to 7.7 seconds. worker and io_uring did keep 7 reads in flight where sync had 1, and the backend spent less time waiting on reads, but the scans didn’t get faster. I see two likely reasons. The storage is a local NVMe drive with kernel readahead, so a synchronous read rarely waits long. And the I/O workers compete with the scanning backend for the same 2 CPUs. Async I/O exists to hide I/O latency, and this setup doesn’t have much latency to hide. Network-attached volumes such as EBS or Persistent Disk add latency to every read, so measure on the storage you actually run before you decide.
io_uring did work inside the pod. Kubernetes runs containers without a seccomp profile unless the pod or the kubelet (seccompDefault) asks for one, while Docker’s default profile has blocked the io_uring syscalls since Docker 25 (moby #46762). Before you set io_method = io_uring in a container, check which profile applies and test a restart.
My first run of this scenario had sync at 38 MB/s on its first scan. It ran right after the 2.9 GB table was created, while the kernel was still writing those pages back to disk. Running all three methods after the table had settled gave the numbers above.
Summary of part 2
Same 2-CPU, 2 GiB Postgres 18 pod as part 1. “Before” is the mistake, “after” is the fix from that section.
| Section | What was measured | Before | After |
|---|---|---|---|
| 6. Autovacuum | index-only scan after a 10% update | 328 ms, 550k heap fetches | 91 ms, 0 |
| 7. random_page_cost | regional report | 2.23 s | 1.25 s |
| 8. Statistics | “newest orders” for an empty city/warehouse pair | 583 ms | 32 ms |
| 9. Generic plans | rare-status query through pgx | 135 ms | 2.2 ms |
| 10. FK index | delete 100 parent rows | 17.9 s | 13 ms |
| 11. Extra indexes | WAL per inserted row | 870 bytes | 280 bytes |
| 13. JIT | VIP report | 584 ms (on) | 555 ms (off), within noise |
| 14. Async I/O | cold 2.9 GB scan, sync vs io_uring |
7.7 s | 7.5 s, within noise |
Across both parts, two of the fourteen mistakes didn’t reproduce on this setup (JIT and async I/O), and two had no demo at all (shared_buffers in part 1, checkpoints here). Those sections still have the check queries. Run them against your own database, because your hardware and workload decide whether the mistake costs you anything.
Part 3 covers the extensions used along the way, driven from Go.
Sources
PostgreSQL documentation: autovacuum, random_page_cost (and the PG 11 text), CREATE STATISTICS, populating a database, PREPARE, foreign keys, JIT, io_method, PG 18 release notes.
Platforms: moby #46762 (Docker seccomp and io_uring).
Further reading, not cited above: pganalyze on Postgres 18 async I/O, pganalyze 5mins on planner tuning and extended statistics, postgresqlco.nf on random_page_cost, Better Stack’s PostgreSQL 18 async I/O guide.