This is the last part of the series. Part 1 and part 2 went through fourteen tuning mistakes. This one covers the extensions I leaned on along the way, each called from Go with pgx and measured on the same 2-CPU, 2 GiB Postgres 18 pod. The code for each one is in postgres-tuning under cmd/scenario.
pg_stat_statements
Covered in mistake 1. One more detail from PG 18: IN (...) lists of different lengths now collapse into one entry, so a query called with 3 ids and with 30 ids no longer shows up as two statements (release notes). The Go side is ordinary querying; printTopStatements in cmd/scenario/measure.go is the version used for the numbers in part 1.
auto_explain: the plan that actually ran
EXPLAIN shows the plan for the query you typed. When the slow path is a prepared statement with a generic plan (mistake 9), the plan you get from psql with a literal value is the good one. auto_explain logs the plan of each execution that crosses a time threshold, including its parameters.
In production, load it through shared_preload_libraries or session_preload_libraries and keep log_analyze off, or use auto_explain.sample_rate, because timing every node has overhead. For a debugging session you can load it in one connection (superuser only, docs) and have the plans sent to the client as notices:
var notices []string
cfg, _ := pgx.ParseConfig(dsn)
cfg.OnNotice = func(_ *pgconn.PgConn, n *pgconn.Notice) {
	notices = append(notices, n.Message)
}
conn, _ := pgx.ConnectConfig(ctx, cfg)

for _, stmt := range []string{
	`LOAD 'auto_explain'`,
	`SET auto_explain.log_min_duration = '50ms'`,
	`SET auto_explain.log_analyze = on`,
	`SET auto_explain.log_buffers = on`,
	`SET auto_explain.log_parameter_max_length = -1`, // log parameter values in full
	`SET auto_explain.log_level = notice`,             // send to the client too
} {
	if _, err := conn.Exec(ctx, stmt); err != nil {
		return err
	}
}
Running the generic-plan workload on that connection (make run S=autoexplain) produced exactly one notice, for the slow call:
duration: 2939.191 ms  plan:
Query Text: SELECT id, customer_id, total, created_at FROM orders
WHERE status = $1 ORDER BY created_at DESC LIMIT 50
Query Parameters: $1 = 'refunded'
Limit  (cost=0.43..10.38 rows=50 width=30) (actual rows=50.00 loops=1)
  Buffers: shared hit=47 read=7225
  I/O Timings: shared read=2712.179
  ->  Index Scan Backward using orders_created_at_idx on orders  (cost=0.43..397977.72 rows=2000003 width=30) (actual rows=50.00 loops=1)
        Filter: (status = $1)
        Rows Removed by Filter: 516889
Filter: (status = $1) and rows=2000003 give it away: this is the generic plan, estimated for an average status. (It took 2.9 s rather than the 135 ms from mistake 9 because this run started with a cold cache. I/O Timings shows 2.7 s of it was reading.)
pg_buffercache and pg_prewarm: after a restart
pg_buffercache shows what’s in shared_buffers. pg_prewarm loads a relation into it on demand, and its autoprewarm worker (on by default when the library is preloaded) saves the list of cached blocks at shutdown and reloads them at startup (docs).
var heapBlocks, idxBlocks int64
err := conn.QueryRow(ctx,
	`SELECT pg_prewarm('customers'), pg_prewarm('customers_pkey')`).Scan(&heapBlocks, &idxBlocks)
What the demo showed (make prewarm). 3,000 random primary-key lookups on customers after a restart, with the OS page cache dropped while Postgres was down:
| After a restart | shared_buffers holds | 3,000 lookups | p50 | p99 | Blocks read from outside shared_buffers |
|---|---|---|---|---|---|
| cold, autoprewarm off | nothing | 1.60 s | 566 µs | 1.10 ms | 4,426 |
then pg_prewarm by hand (took 204 ms) |
all of customers and its pkey |
0.27 s | 88 µs | 133 µs | 0 |
| cold, autoprewarm on (block list saved before the restart) | 80 MB of 80 MB, 21 MB of 21 MB | 0.28 s | 92 µs | 134 µs | 24 |
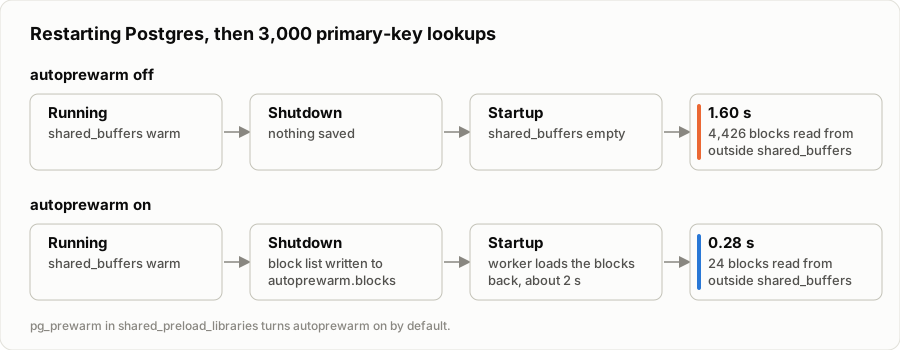
(The only difference is the block list written at shutdown and read back at startup.)
Loading 100 MB took 0.2 seconds, and lookups ran about six times faster afterwards. With autoprewarm on, the cache was back to almost the same state 2 seconds after startup, without anyone running anything. If your database gets restarted for minor version upgrades or pod rescheduling, this is the cheapest fix in the whole series: add pg_prewarm to shared_preload_libraries and autoprewarm runs by default.
The block list holds all of shared_buffers (autoprewarm_dump_now() wrote 65,536 blocks, the full 512 MB), so after a restart the cache looks the way it did at shutdown, not only for the tables you care about.
pgstattuple and pg_repack: measuring and removing bloat
n_dead_tup is an estimate. pgstattuple reads the table and reports exact live, dead and free space, and pgstatindex does the same for a B-tree. Both read the whole relation, so run them on a replica or at a quiet time on big tables. pgstattuple_approx is a cheaper variant.
err := pool.QueryRow(ctx, `
	SELECT pg_size_pretty(t.table_len), t.tuple_percent, t.dead_tuple_percent, t.free_percent,
	       i.avg_leaf_density
	FROM pgstattuple($1::regclass) t, pgstatindex($2::regclass) i`,
	table, table+"_pkey").Scan(&size, &tuplePct, &deadPct, &freePct, &leafDensity)
Plain VACUUM makes dead space reusable but rarely gives it back to the OS. VACUUM FULL rewrites the table and holds an ACCESS EXCLUSIVE lock on it “while it is being processed” (docs), blocking reads and writes. pg_repack builds the new copy online and only takes the exclusive lock briefly at the start and at the final swap (pg_repack docs). It needs a primary key or a unique index on a NOT NULL column, and the client binary has to match the extension version, which is why the scenario image ships both from one package.
What the demo showed (make run S=repack). Two copies of a 1.5M-row table, 70% of rows deleted, then plain VACUUM. A Go goroutine updates random surviving rows the whole time:
| Heap before | Heap after | Duration | Writer’s slowest update | Updates over 100 ms | |
|---|---|---|---|---|---|
VACUUM FULL |
355 MB, 69% free | 106 MB, 1.4% free | 10.7 s | 10.7 s | 1 (it waited the whole time) |
pg_repack --no-order |
355 MB, 69% free | 106 MB, 1.4% free | 9.2 s | 0.93 s | 20 |
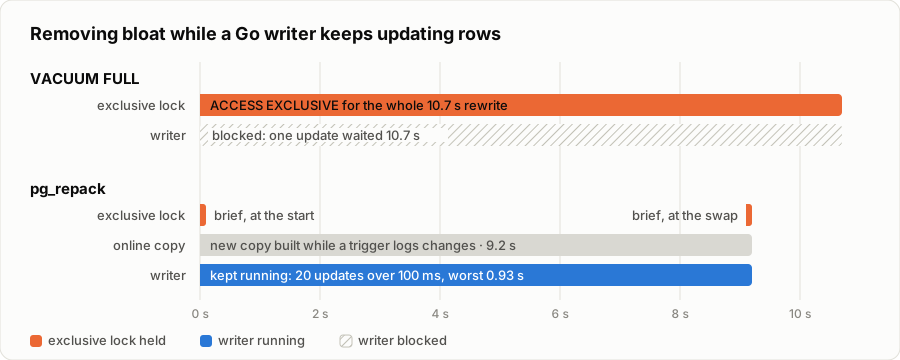
(Where each one holds the exclusive lock, and what the Go writer was doing meanwhile.)
Same result on disk, and the primary key’s leaf density went from 27% to 90% in both cases. With VACUUM FULL the writer was blocked for the entire rewrite. With pg_repack the writer kept going, though not untouched: the slowest update took 0.93 s, and 20 took over 100 ms. My guess is the brief exclusive lock at the swap plus the trigger pg_repack adds to capture changes during the copy, but I didn’t trace it. On an earlier run of the same scenario, VACUUM FULL took 2.5 s and pg_repack’s worst stall was 109 ms.
What matters is how each one scales. VACUUM FULL blocks writes for as long as the rewrite takes, which for a 50 GB table is minutes. pg_repack only needs its exclusive lock at the start and at the swap.
hypopg: try an index before building it
hypopg creates hypothetical indexes that exist only in your session’s memory. Plain EXPLAIN (not EXPLAIN ANALYZE) then shows whether the planner would use them (hypopg).
var name string
var estSize int64
err := conn.QueryRow(ctx,
	`SELECT indexname, hypopg_relation_size(indexrelid)
	 FROM hypopg_create_index('CREATE INDEX ON customers (email)')`).Scan(&name, &estSize)
// EXPLAIN now shows: Index Scan using "<13640>btree_customers_email" on customers
What the demo showed (make run S=hypopg). Two candidate indexes on the 1M-row customers table:
| Query | hypopg says | Estimated size | Real index | Real size | Planner uses real index |
|---|---|---|---|---|---|
WHERE email = '...' |
Index Scan | 47 MiB | built in 6.5 s | 38 MiB | yes |
count(*) WHERE tier = 'standard' (90% of rows) |
Seq Scan, not used | 27 MiB | built in 1.2 s | 6 MiB | yes, Index Only Scan |
The first case is what hypopg is for: an answer in 3.6 ms instead of a 6.5 s build. The second shows where it stops being reliable. tier has three values, and B-tree deduplication (PG 13+) stores each value once per leaf page with a list of row pointers, so the real index is 6 MiB. hypopg’s estimate doesn’t seem to account for deduplication. Its source never mentions it, and the one pull request that discussed it (#64, “Postgres 13 deduplication is not yet considered”) was closed without merging. That’s my reading of the code, not something the project documents.
With the inflated size the hypothetical index looked too expensive, while the real one gave an index-only scan. hypopg’s answer depends on its size estimate, so treat “would not be used” as a hint, not a verdict, especially for low-cardinality columns.
pgvector: recall, ef_search and filtering
pgvector’s HNSW index trades recall for speed. Defaults are m = 16 and ef_construction = 64 at build time, and hnsw.ef_search = 40 at query time (pgvector). Vectors can go over the wire as text and be cast on the server, so the Go side needs nothing beyond pgx:
const knn = `SELECT id FROM items ORDER BY embedding <-> $1::text::vector LIMIT 10`

err := pgx.BeginFunc(ctx, conn, func(tx pgx.Tx) error {
	if _, err := tx.Exec(ctx, "SET LOCAL hnsw.ef_search = 100"); err != nil {
		return err
	}
	rows, err := tx.Query(ctx, knn, "[0.12,0.98,...]")
	if err != nil {
		return err
	}
	ids, err = pgx.CollectRows(rows, pgx.RowTo[int32])
	return err
})
What the demo showed (make run S=pgvector). 100k 128-dimensional vectors around 100 cluster centers, 50 categories, and 50 queries that are existing items plus noise. Recall@10 is measured against an exact sequential scan:
| recall@10 | p50 | |
|---|---|---|
| exact (no index) | 1.000 | 66.8 ms |
ef_search = 10 |
0.912 | 0.73 ms |
ef_search = 40 (default) |
0.930 | 1.01 ms |
ef_search = 100 |
0.934 | 1.33 ms |
ef_search = 200 |
0.934 | 1.62 ms |
My first run used uniformly random vectors and got recall 0.26 at the default setting. Uniform random data in 128 dimensions has no neighborhood structure for the graph to follow, so it’s a poor stand-in for real embeddings. If you benchmark pgvector, use your own embeddings. Recall stopped at 0.934. Raising ef_search past 100 didn’t move it, and I didn’t dig into which queries were missing neighbors.
Filtering is where the default catches people out. The index returns ef_search candidates and the WHERE clause is applied afterwards. With a filter that keeps 2% of rows, 40 candidates leave fewer than one match on average. pgvector 0.8 added iterative index scans, which keep scanning until the LIMIT is satisfied:
Filtered top-10 (WHERE category = $2, 2% of rows) |
Rows returned per query | recall@10 | p50 |
|---|---|---|---|
hnsw.iterative_scan = off |
0.7 | 0.062 | 0.99 ms |
hnsw.iterative_scan = relaxed_order |
10.0 | 0.926 | 2.55 ms |
| exact (no index) | 10 | 1.000 | 16.2 ms |
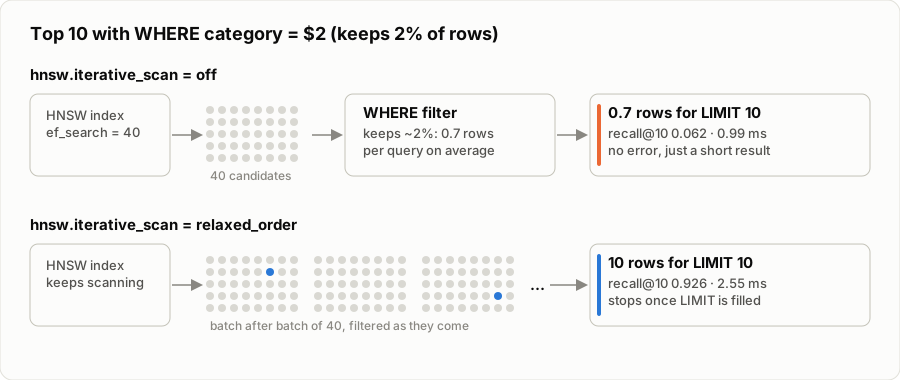
(The filter runs after the index, so the index has to keep going for the LIMIT to fill.)
The query without iterative scan didn’t error. It returned 0.7 rows for a LIMIT 10, which nobody is likely to catch in code review.
One Kubernetes note: building that index with maintenance_work_mem = 512MB failed with could not resize shared memory segment ... No space left on device. A parallel HNSW build keeps the graph in dynamic shared memory, which in a container lives in /dev/shm, and this pod mounts a 256 MiB memory-backed emptyDir there. The pgvector README mentions this for Docker: “make sure --shm-size is at least that size to avoid an error with parallel HNSW index builds” (README). In Kubernetes the equivalent is the sizeLimit of that volume. Either size /dev/shm for your maintenance_work_mem or keep maintenance_work_mem under it.
Summary of part 3
Same 2-CPU, 2 GiB Postgres 18 pod as the rest of the series.
| Extension | What was measured | Before | After |
|---|---|---|---|
| pg_prewarm | 3,000 lookups after a restart | 1.60 s | 0.28 s (autoprewarm) |
| pg_repack | writer’s worst stall while removing bloat | 10.7 s (VACUUM FULL) | 0.93 s |
| pgvector | filtered top-10: rows returned | 0.7 | 10 (iterative_scan) |
The repo has every scenario from all three parts, and the raw output of each run is in results/.
Sources
PostgreSQL documentation: pg_stat_statements, auto_explain, pg_prewarm, VACUUM, PG 18 release notes.